Time Interval and Graphs on Grafana Dashboards
Published on Wed Oct 18 2023
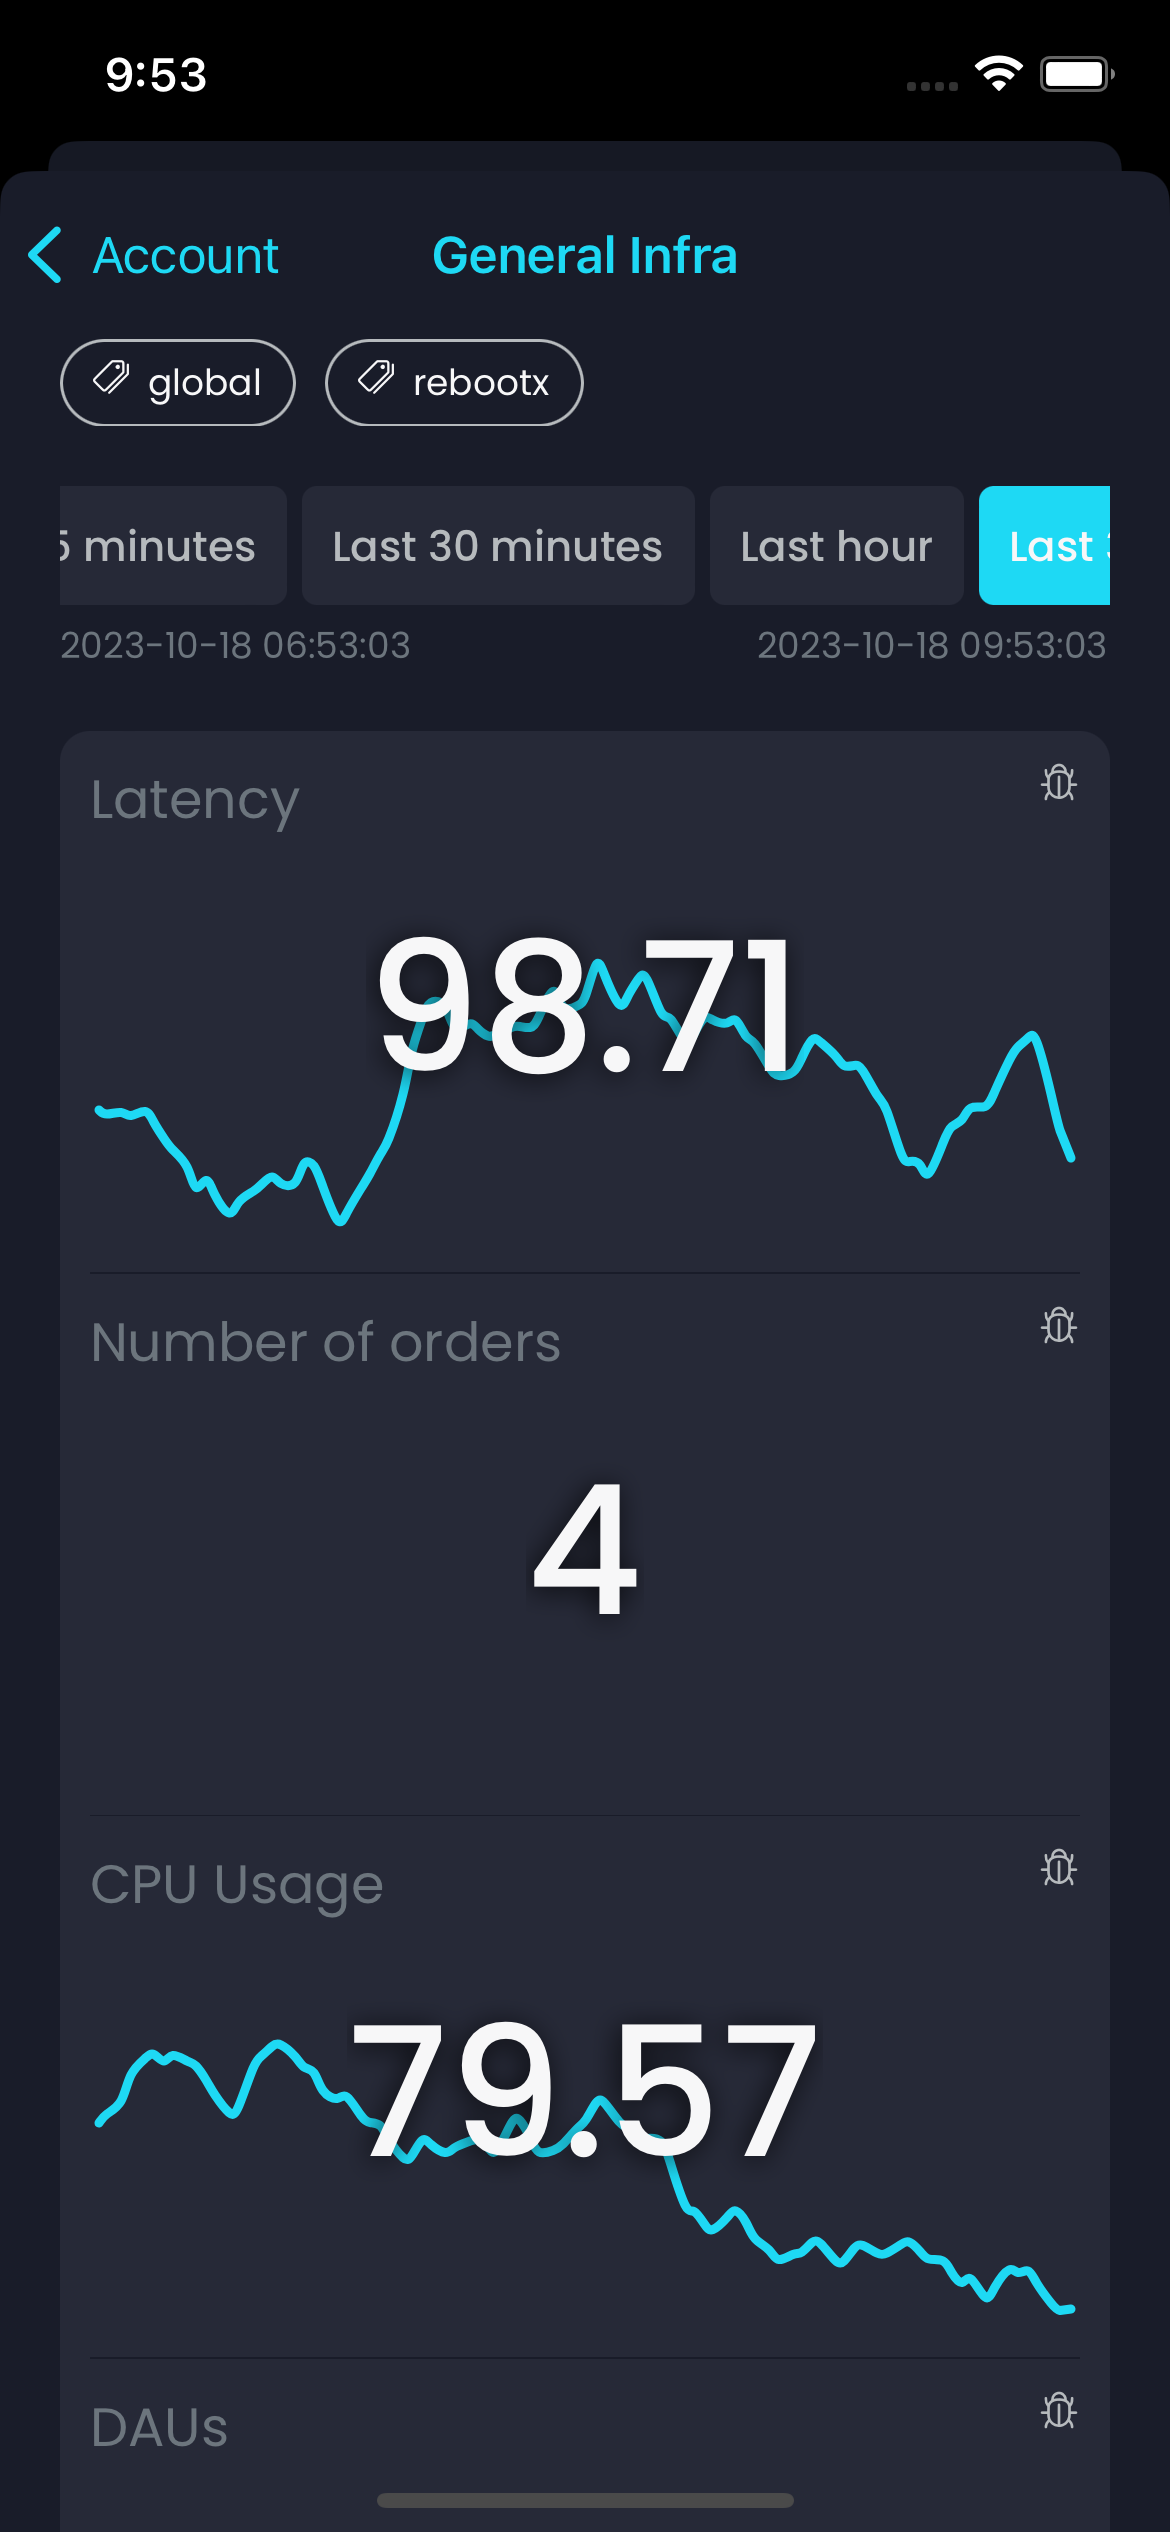
Exciting Grafana integration update! Now with version requirement notes (>9.1) during account connection, customizable time intervals for metric display, and a fantastic addition—visual graphs linked to your metrics. Enjoy these new features! 📊✨
The Grafana integration has been improved.
We've added a note to explain the version requirements (> 9.1) when you connect your account.
You can now customize the time interval displaying your metrics (Last 15 minutes, Last 3 hours, Last 30 days, etc.).
 RebootX Dashboard
And the best for the end : we now show the graph associated to your metrics.
Hope you'll enjoy using these new features.
Chafik H'nini
