Improved Grafana Integration
Grafana's update improves dashboard folder displays, supports dynamic datasources, and streamlines variable resolution.
The Grafana integration has been drastically improved : display of the dashboard folder when applicable, display of the default value of a metric when available, support of dynamic datasources (e.g. $[DS_PROMETHEUS]) with dashboard variables.
Dashboards list with folders
 Dashboards with their folder
Some of you reported that you had dashboards with the same name in multiple folders. In this case, it makes more sense to display the folder name alongside the dashboard to have a better view of what is what.
By the way, we have started investigating a "tree" view but it is still in experiments since we do not want to complexify the product too much. It is important to find things quickly when you need them (i.e. in case of incident/emergency).
In the future, we will also add the notion of folder to rebootx-on-prem. Feel free to upvote the issue if that is something you want us to work on.
Grafana Dashboard Variables
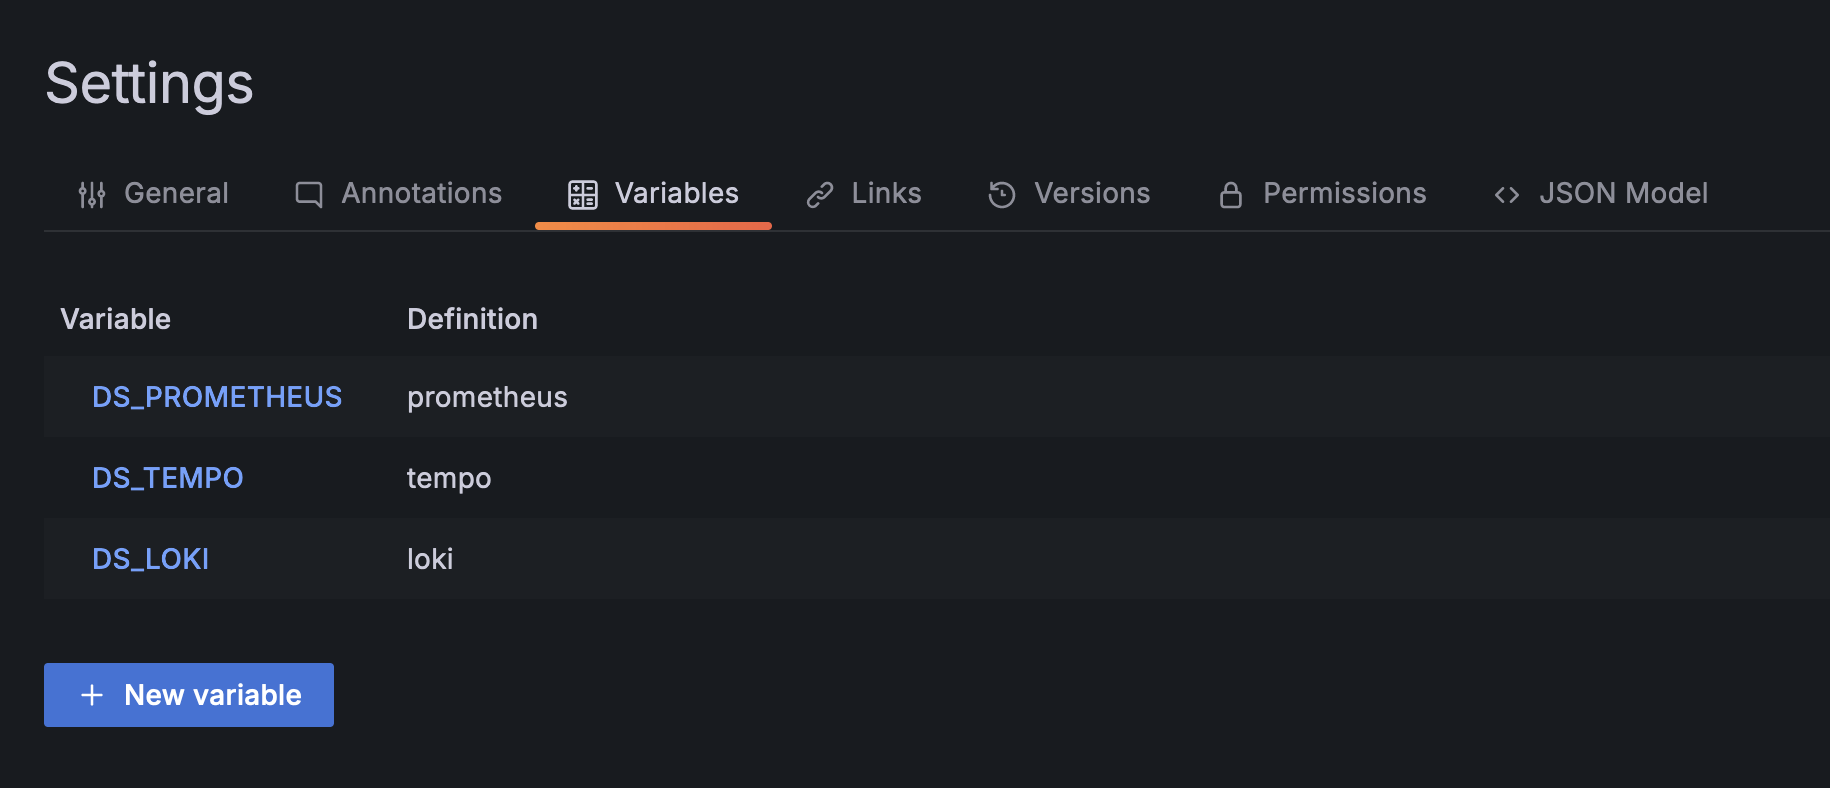
 Grafana dashboard variables
Some panels define their datasource dynamically (e.g. $[DS_PROMETHEUS]). In this case, we were not resolving it before. It is now being handled. Whenever we see a variable, we replace its value from the dashboards variables list before sending the query.
Misc
More generally, this update also contains usual maintenance to keep high quality standards.
And last but not least, we have decommissioned the cloud prices feature because it didn't bring much value to you.
As usual, feel free to contact us if you need any help.
Chafik H'nini
