Prometheus node-exporter integration
Published on Tue May 14 2024
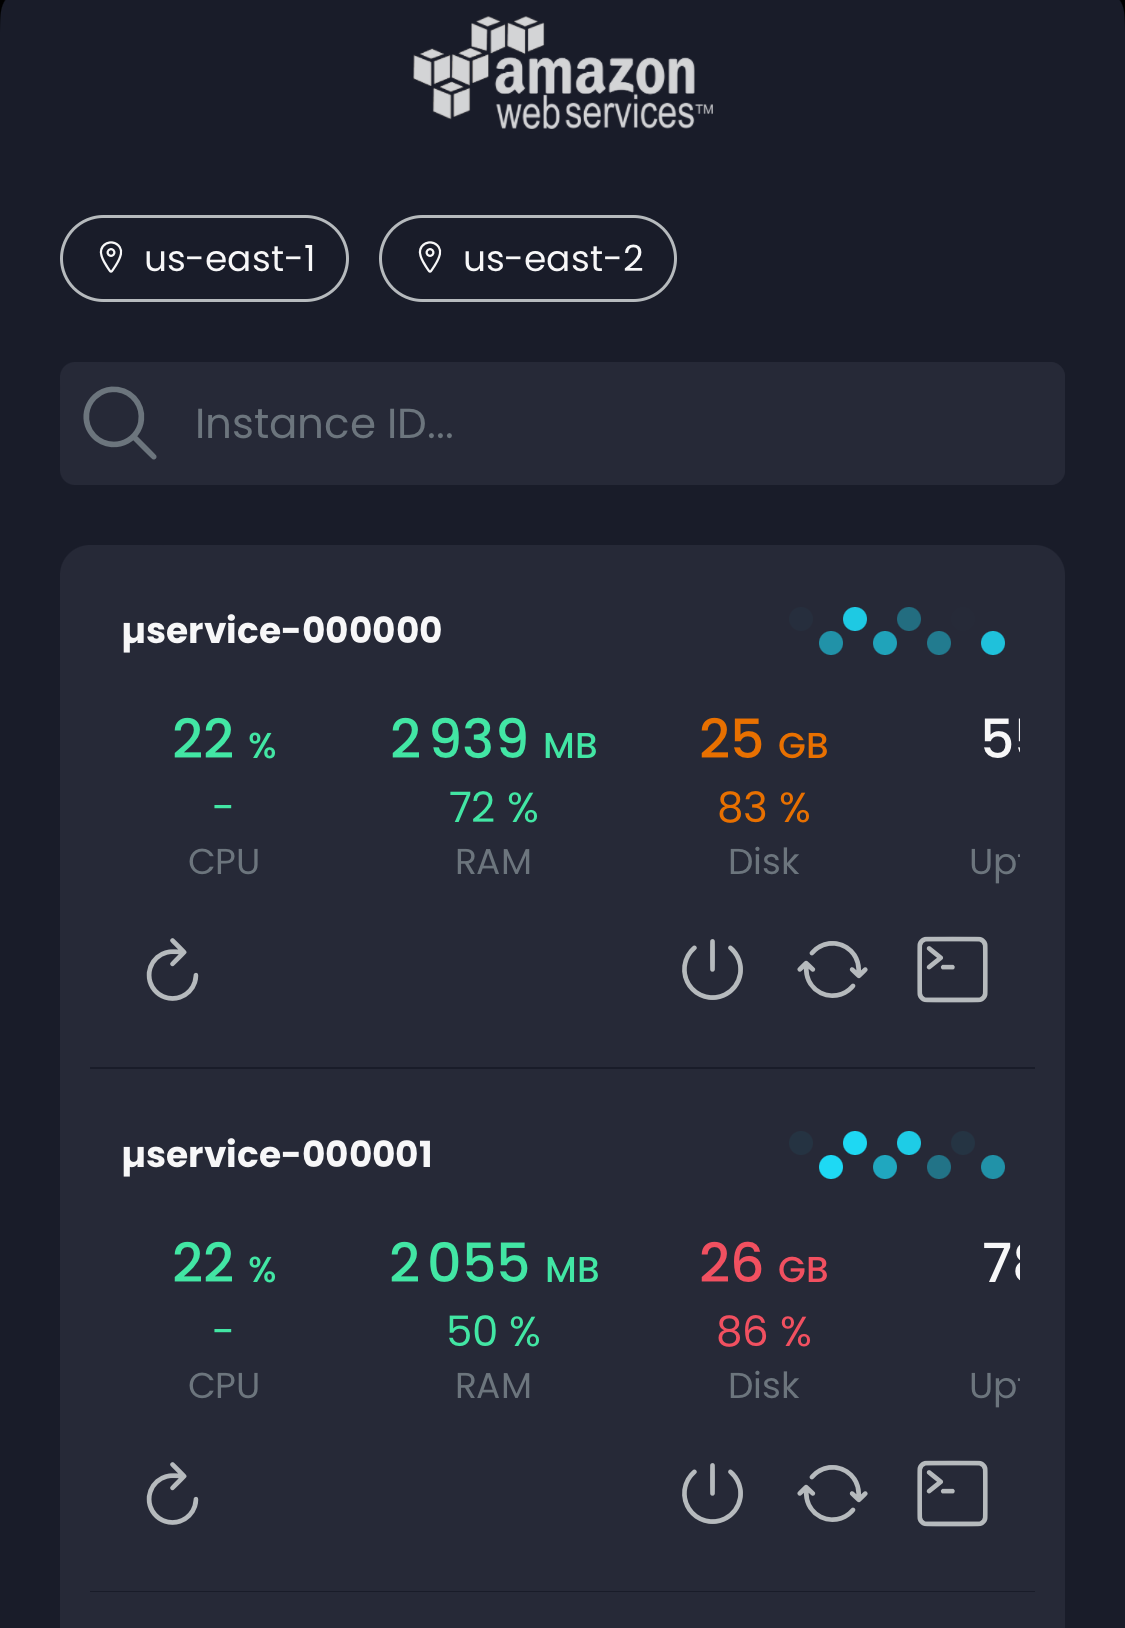
Automatically visualize CPU, RAM, Disk, and Uptime metrics of instances; connects via SSH for IaaS (e.g., AWS, Azure) and API for PaaS (e.g., Clever Cloud).
Visualize the metrics (CPU, RAM, Disk, Uptime) of your instances automatically.
For IaaS providers (e.g. AWS, Azure, GCP), the app connects directly via SSH to your servers and fetches the metrics exposed by node-exporter at localhot:9001/metrics (no need for Prometheus, nor Grafana !).
For PaaS providers (e.g. Clever Cloud), the metrics from the API are displayed.
 Prometheus node-exporter metrics AWS
